

Cut down on alcohol.
Take Control of your health.
Launching soon on


Small changes
Big results:
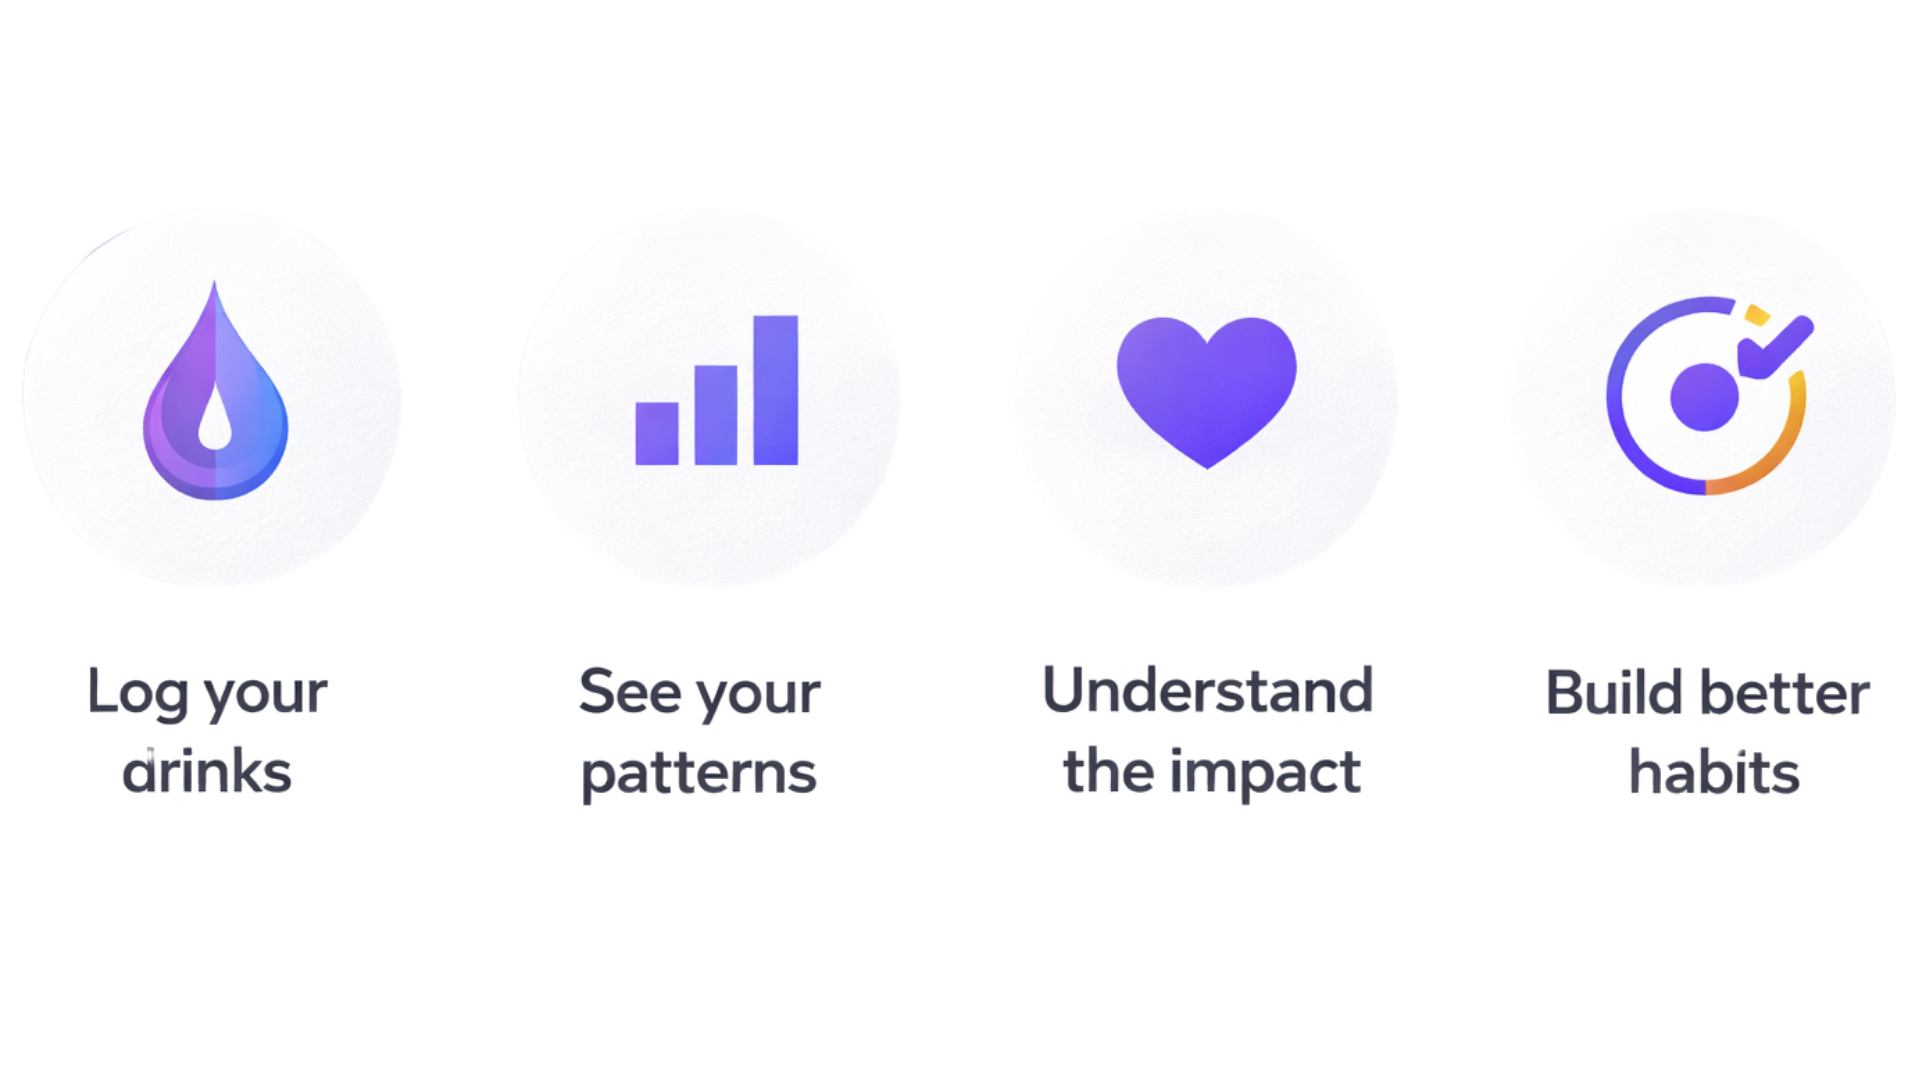
Log your drinks
Quick and simple tracking
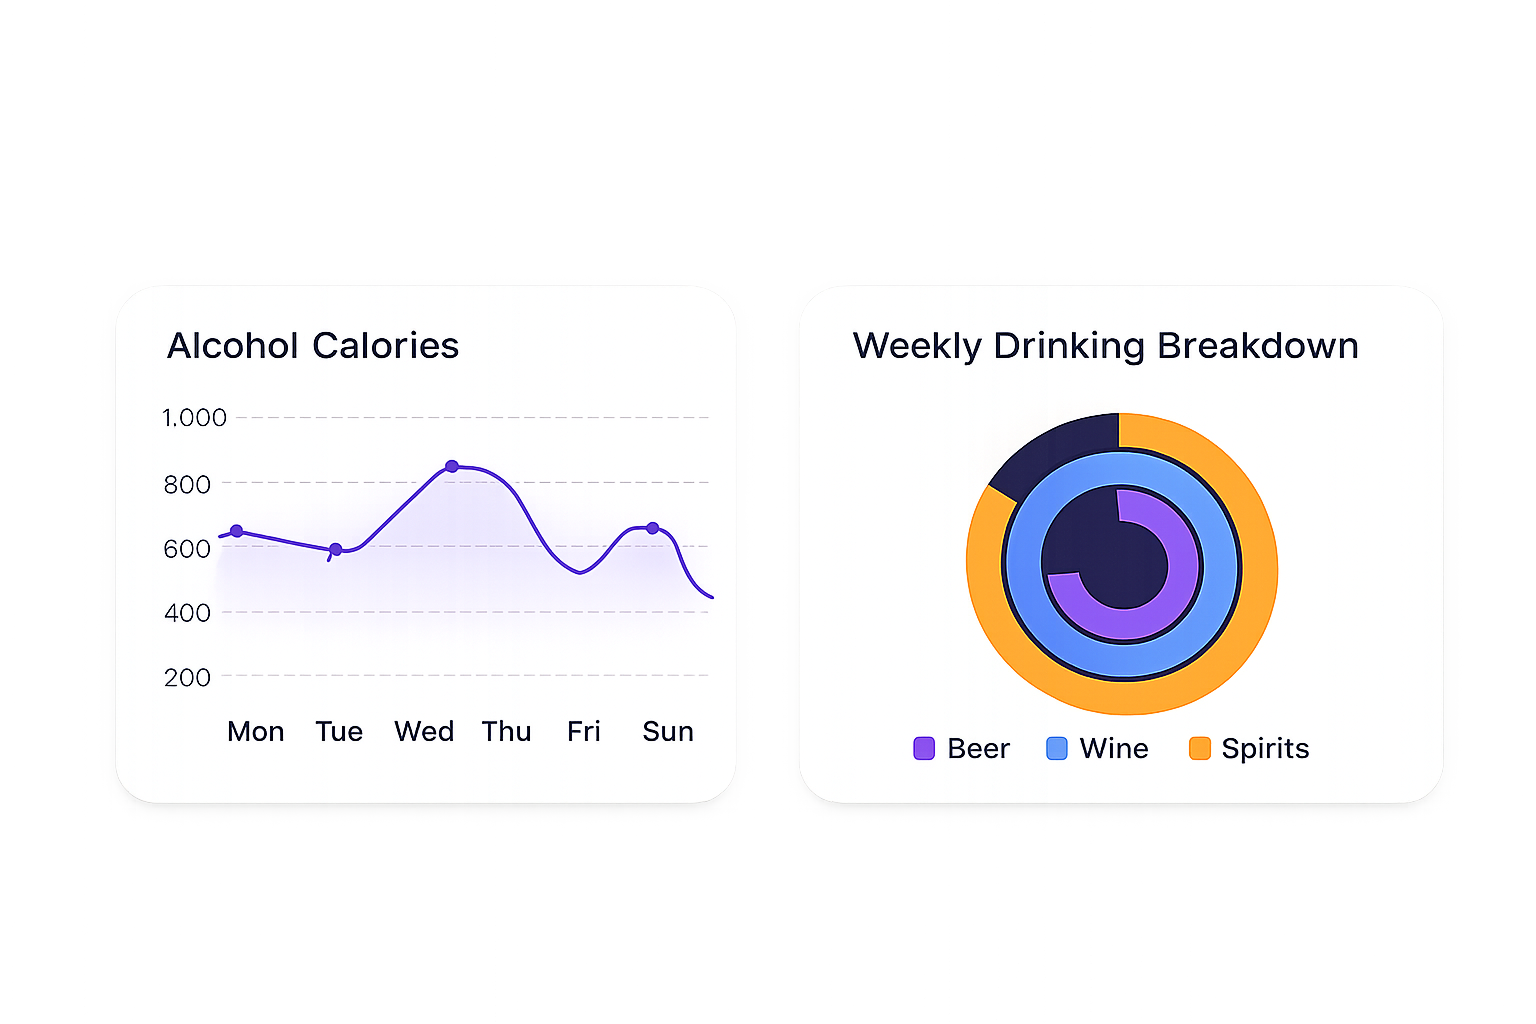
See your patterns
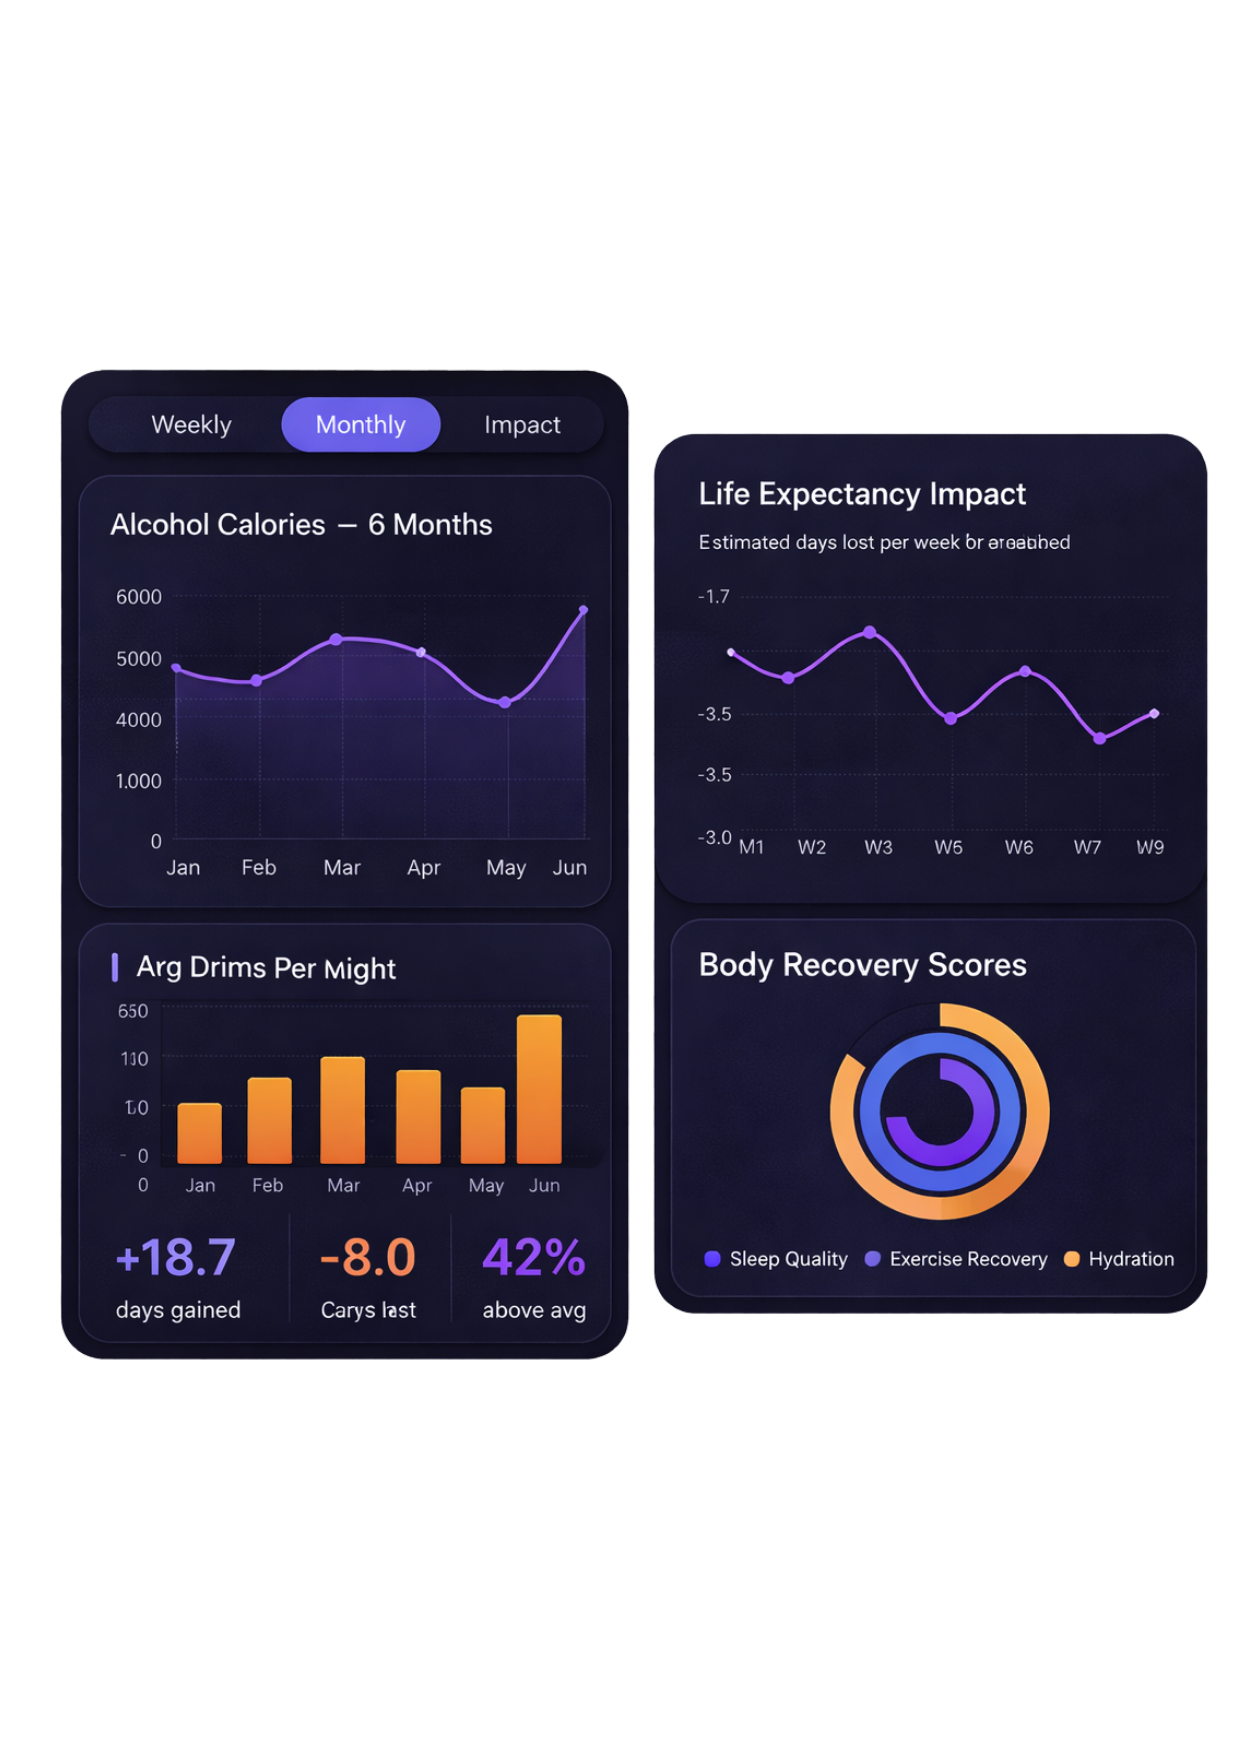
Track alcohol, calories, and trends
Understand the impact
See how drinking affects your health
Build better habits
Personalised insights and goals
How CalDrop works
Small changes. Big results.
Track alcohol intake and calories
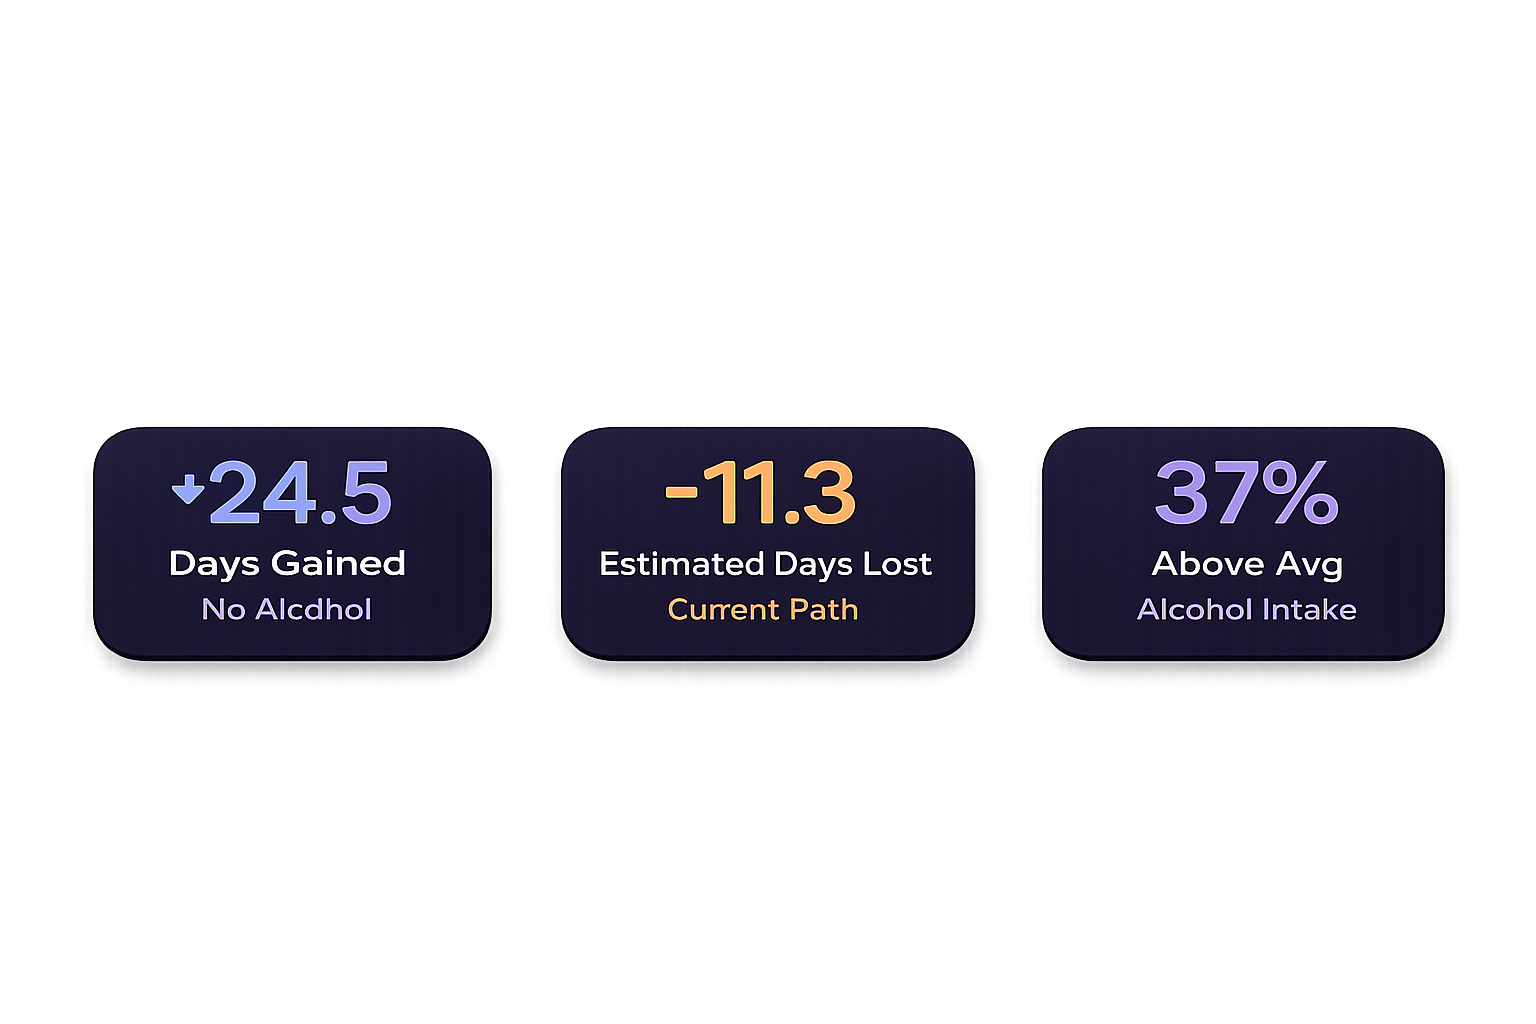
See your health and longevity impact
Get personalised insights and goals